

Operaブラウザー
で何ができますか?
新着情報を確認する
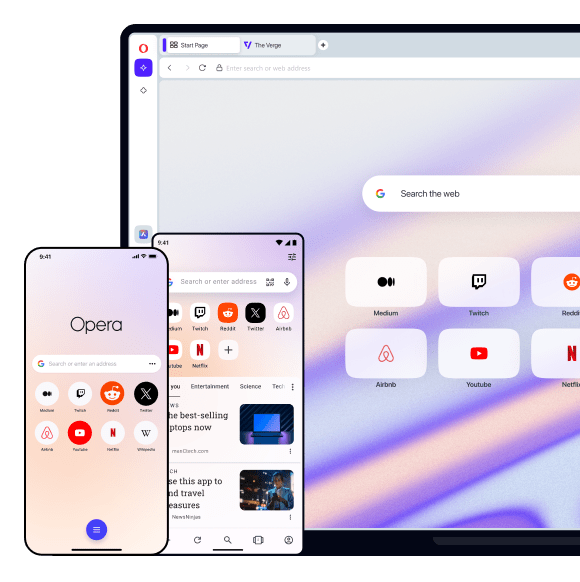


選ばれる数百万人に選ばれた
他のブラウザがデバイスにプリインストールされているために使用を強制するのに対し、Operaは優れたパフォーマンスのために何百万人ものユーザーに選ばれています。


信頼できるセキュリティ
25年以上にわたり、Operaはブラウザ技術の拡大に取り組み、ユーザーがオンラインで最高のセキュリティ、プライバシー、柔軟性を持つことを確認しています。


将来に対応した
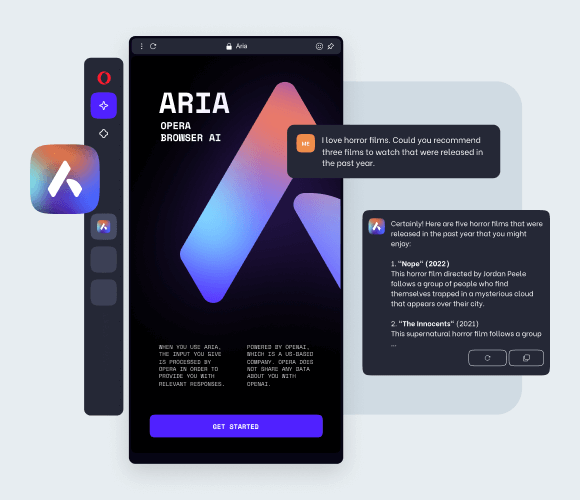
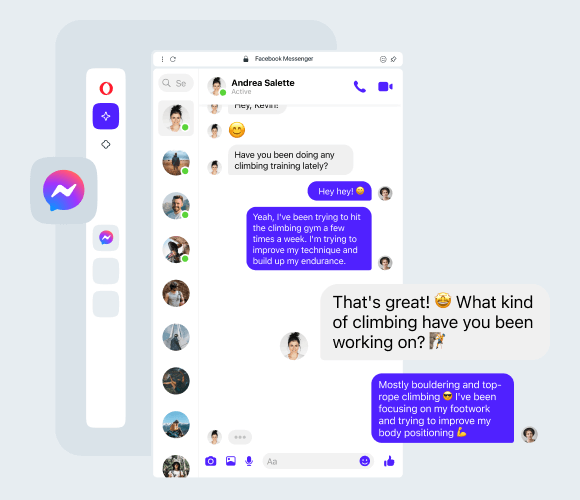
Operaは、AI、Web3、および先進的な革新的な機能への無料アクセスを提供し、予期せぬ方法でWebを形作っています。オンラインで可能なことの表面しか削り取っていない状況で、Operaよりもこの未来を構築するのに。
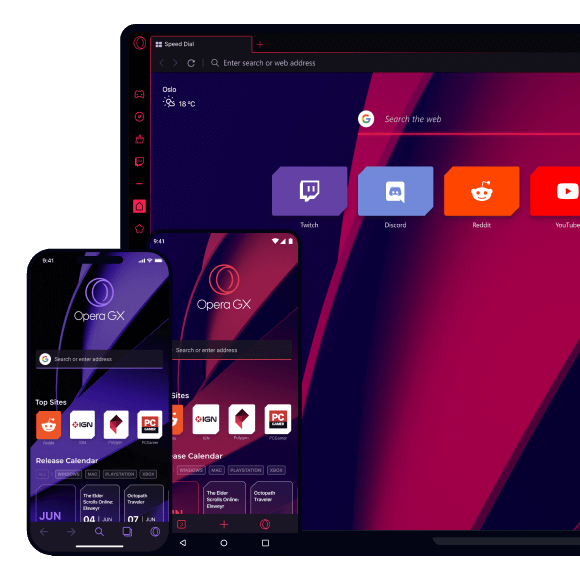
Operaのゲーム製品を発見する


私たちについて
誰
Operaは人々です。ヨーロッパ、アフリカ、アジアにまたがる開発者、デザイナー、研究者、マーケター、サポートの国際チームが、どんなデバイスでも最高のオンライン体験を構築するために結集しています。野心的で実。
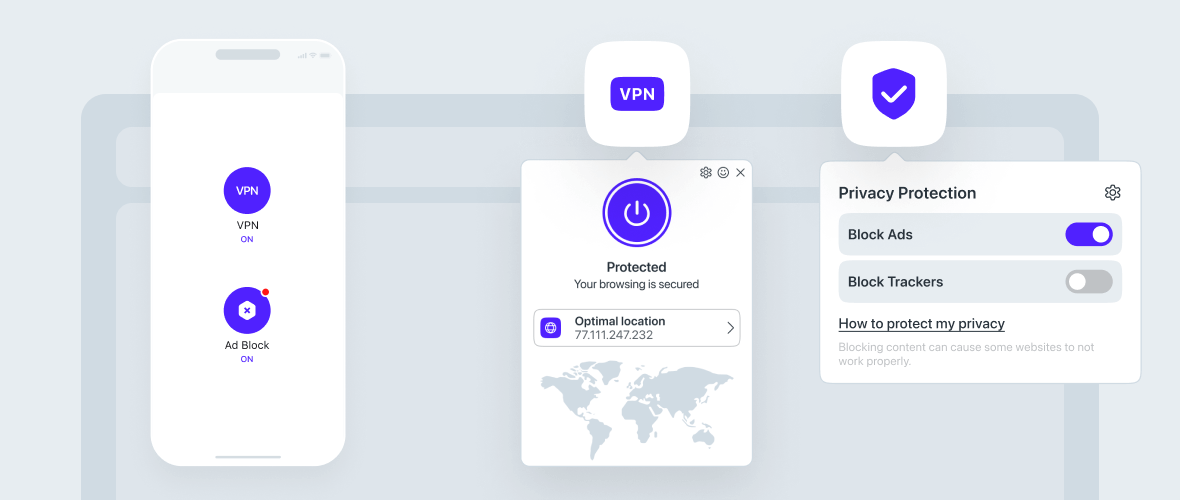
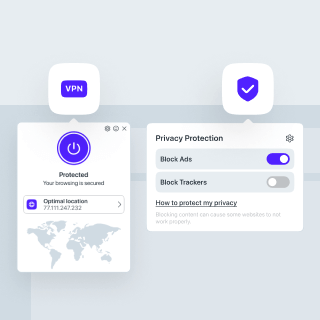
あなたはより良いブラウザを受けるに値します
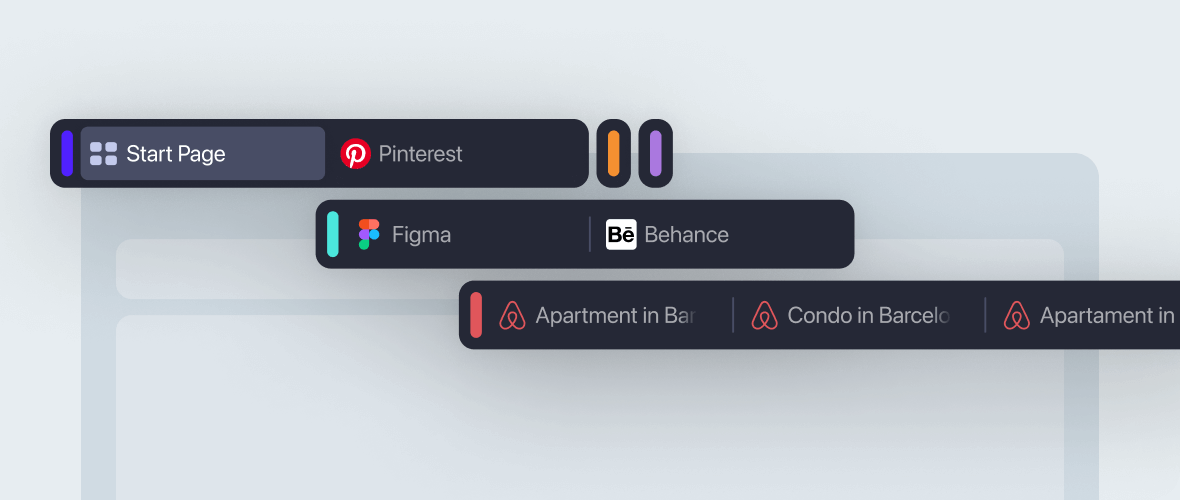
Operaには、無料のVPN、広告ブロッカー、Flowファイル共有など、高速でスムーズで邪魔されないブラウジングのために必要な機能がいくつか組み込まれています。オンライン体験を向上させる。